Strategies to navigate the design challenges in Geographic Information System (GIS) solutions
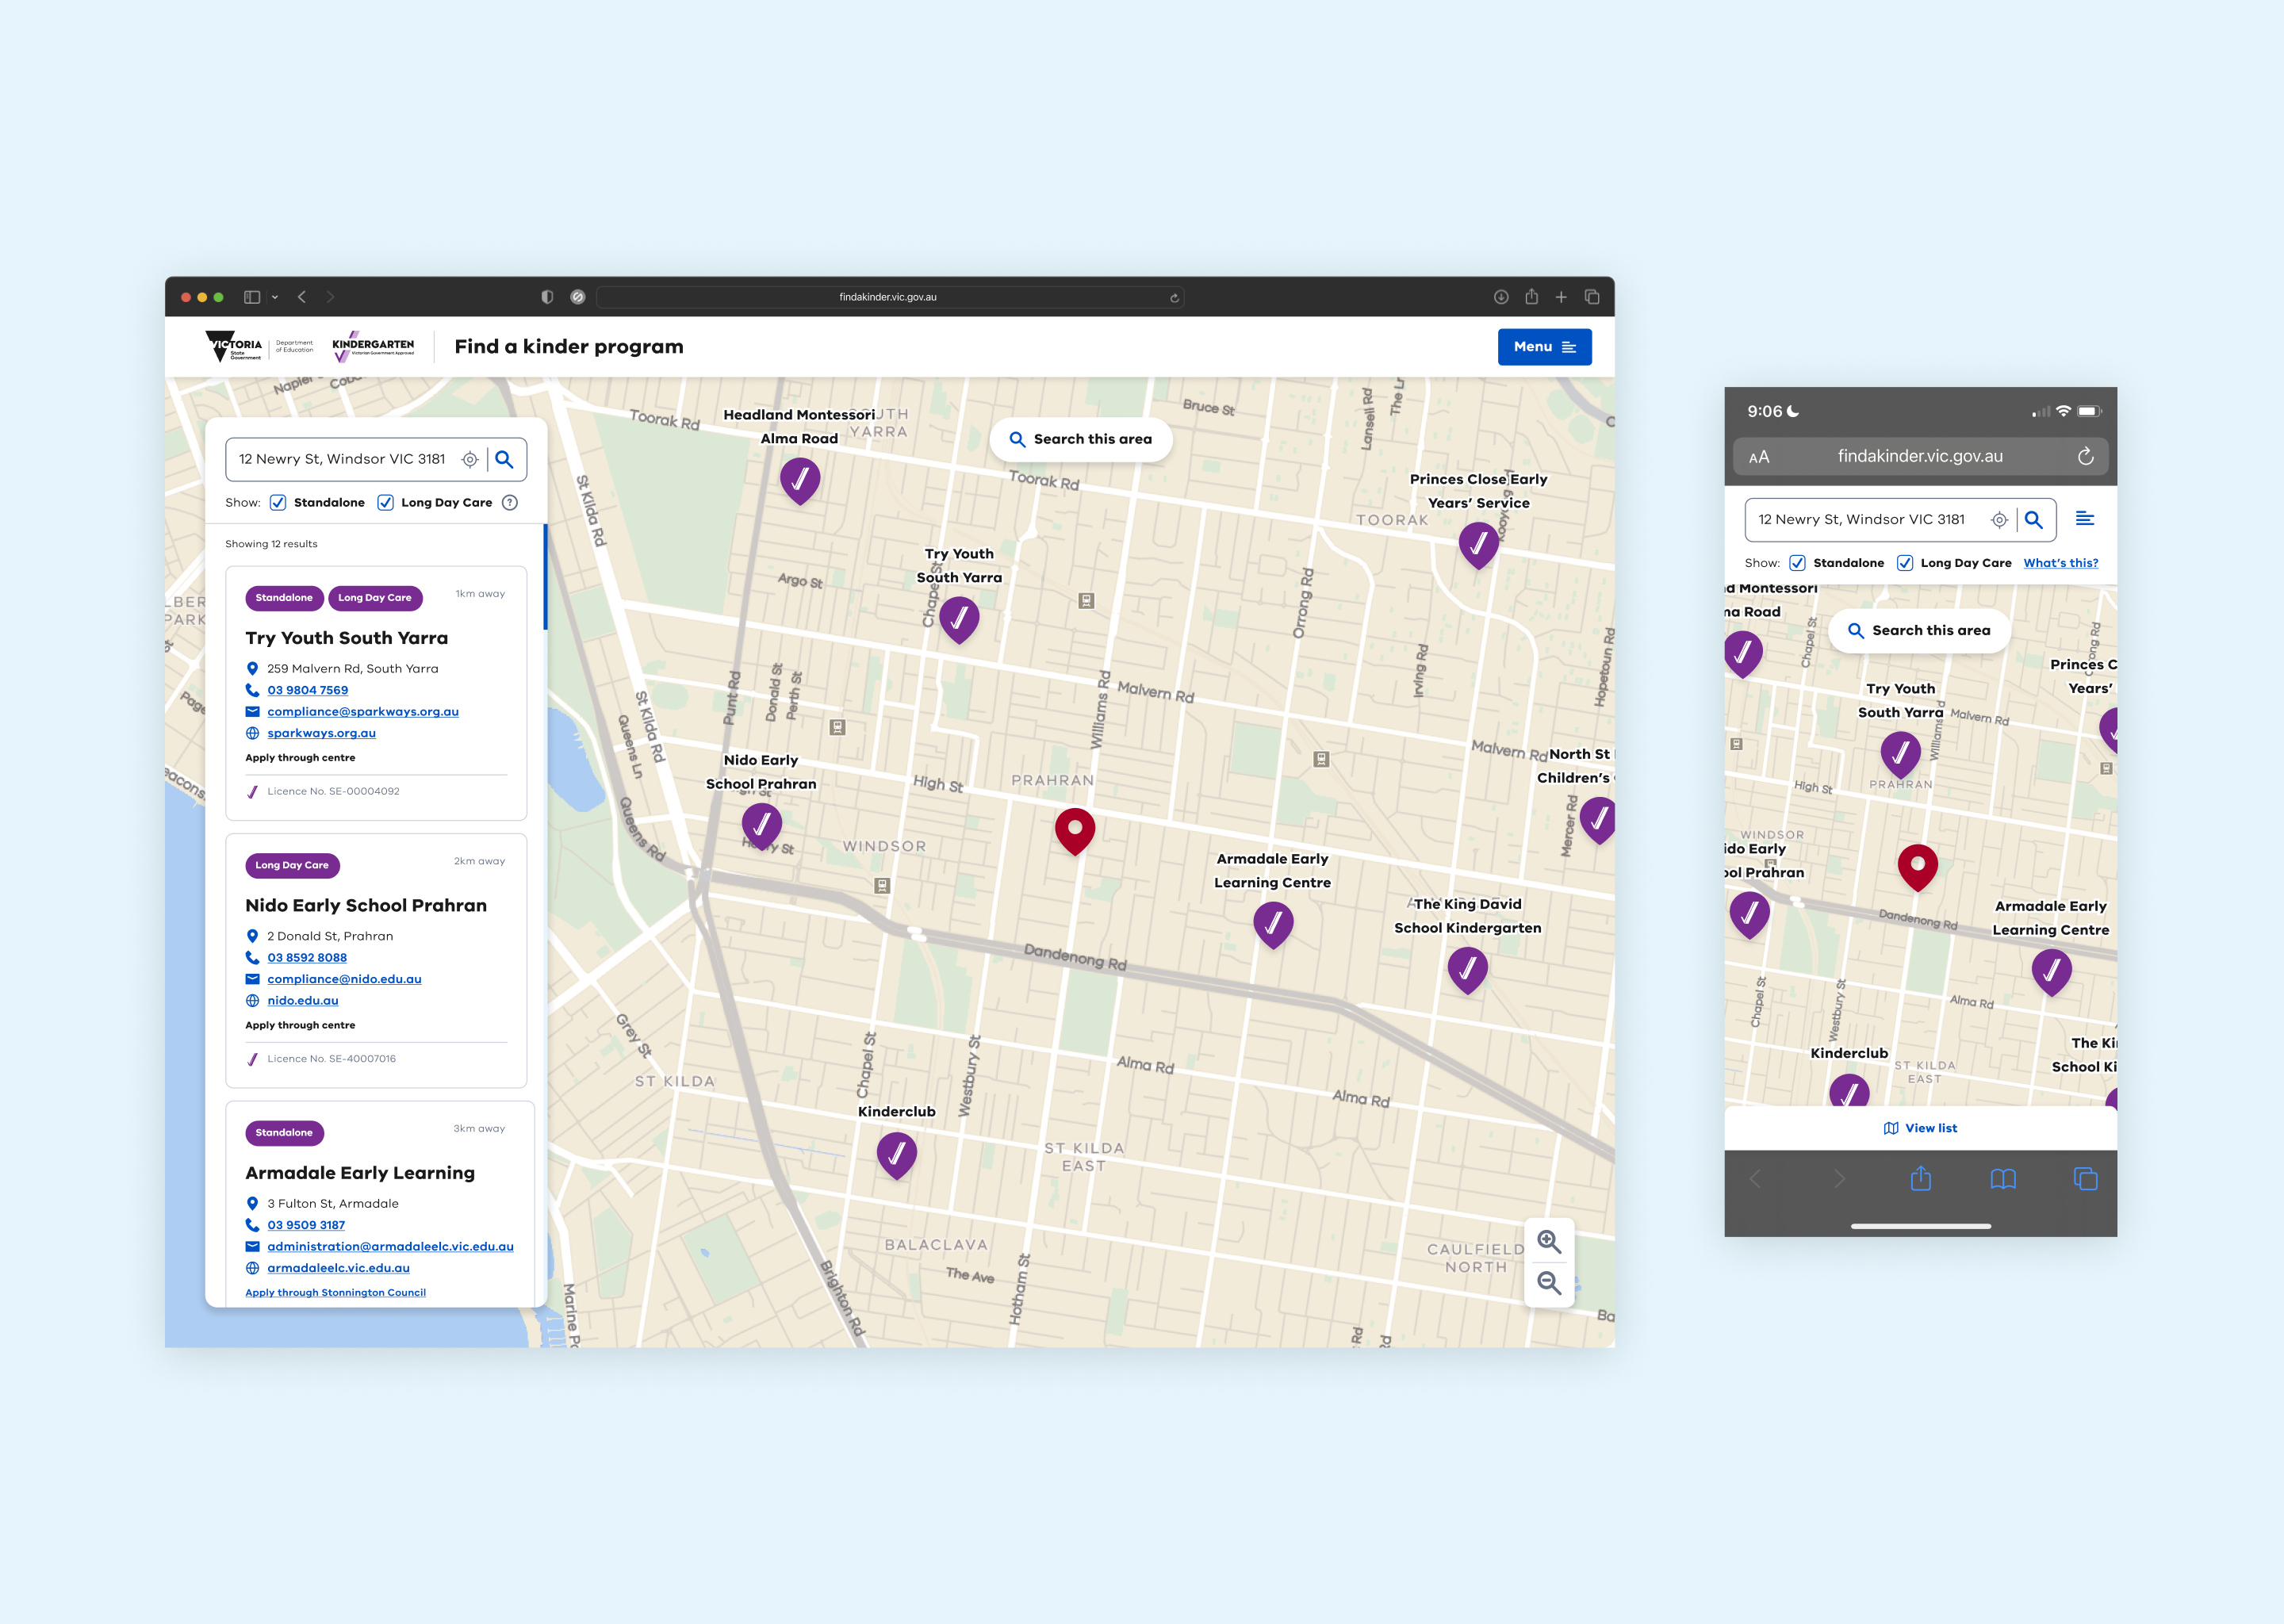
Designing an effective GIS solution is a complex task. At Conduct, we have substantial experience in this area. We’ve created practical map-based GIS solutions for both consumer-focused projects like the Department of Education and Training’s Find a Kinder program, and operational support for field-based teams, like our work with ETS Infrastructure Management on the CanopyIQ platform. In this article, we’ll explore the main challenges we see time and time again with GIS solution design and we’ll also share insights around how to overcome them.
The three key challenges of designing GIS solutions
1: Map-based interfaces have inherently high visual load
Maps are data-rich, dense and lack ‘negative space’ – all factors which present a design challenge. Adding information can increase extraneous cognitive load for the user, making content interpretation difficult. Consequently, users may misinterpret content and miss additional functions and information that the map has to offer.
2: Significant data volumes and processing power are required
Displaying and processing dense data in maps is technically demanding. Slow internet worsens challenges, impacting GIS tasks like alerts, geofencing, and route tracking. Laggy solutions lead to user frustration, risking task abandonment or even dismissing an entire solution. The implications are significant, especially for field-based workers, as delays in their ability to complete tasks can introduce operational inefficiencies.
3: Users have pre-established mental models based on incumbent solutions
Google Maps sets the standard in GIS design. Users expect similar experiences, influenced by their familiarity with Google Maps. While this familiarity can be advantageous, it can also limit design experimentation and creativity, and users may initially find it challenging to adapt to any designs that deviate from the norm. This could lead to a less intuitive and satisfying experience. In this case, extra effort may be required to overcome user resistance or hesitation.
Conduct’s six key learnings from designing and implementing GIS solutions
1: Minimal information
Provide users with essential information to avoid cognitive overload. Techniques like dynamic clustering, selective use of color, and user filtering help manage information density effectively.
2: Use Proven Patterns
Follow established design patterns like Google Maps for intuitive interfaces:
- Interactive zooming and panning
- Search bar for addresses and locations
- Location-based services for points of interest
- Visual cues like markers, icons, layers, overlays
- Intuitive interactions with clear visual cues
- Test designs for user understanding and feedback
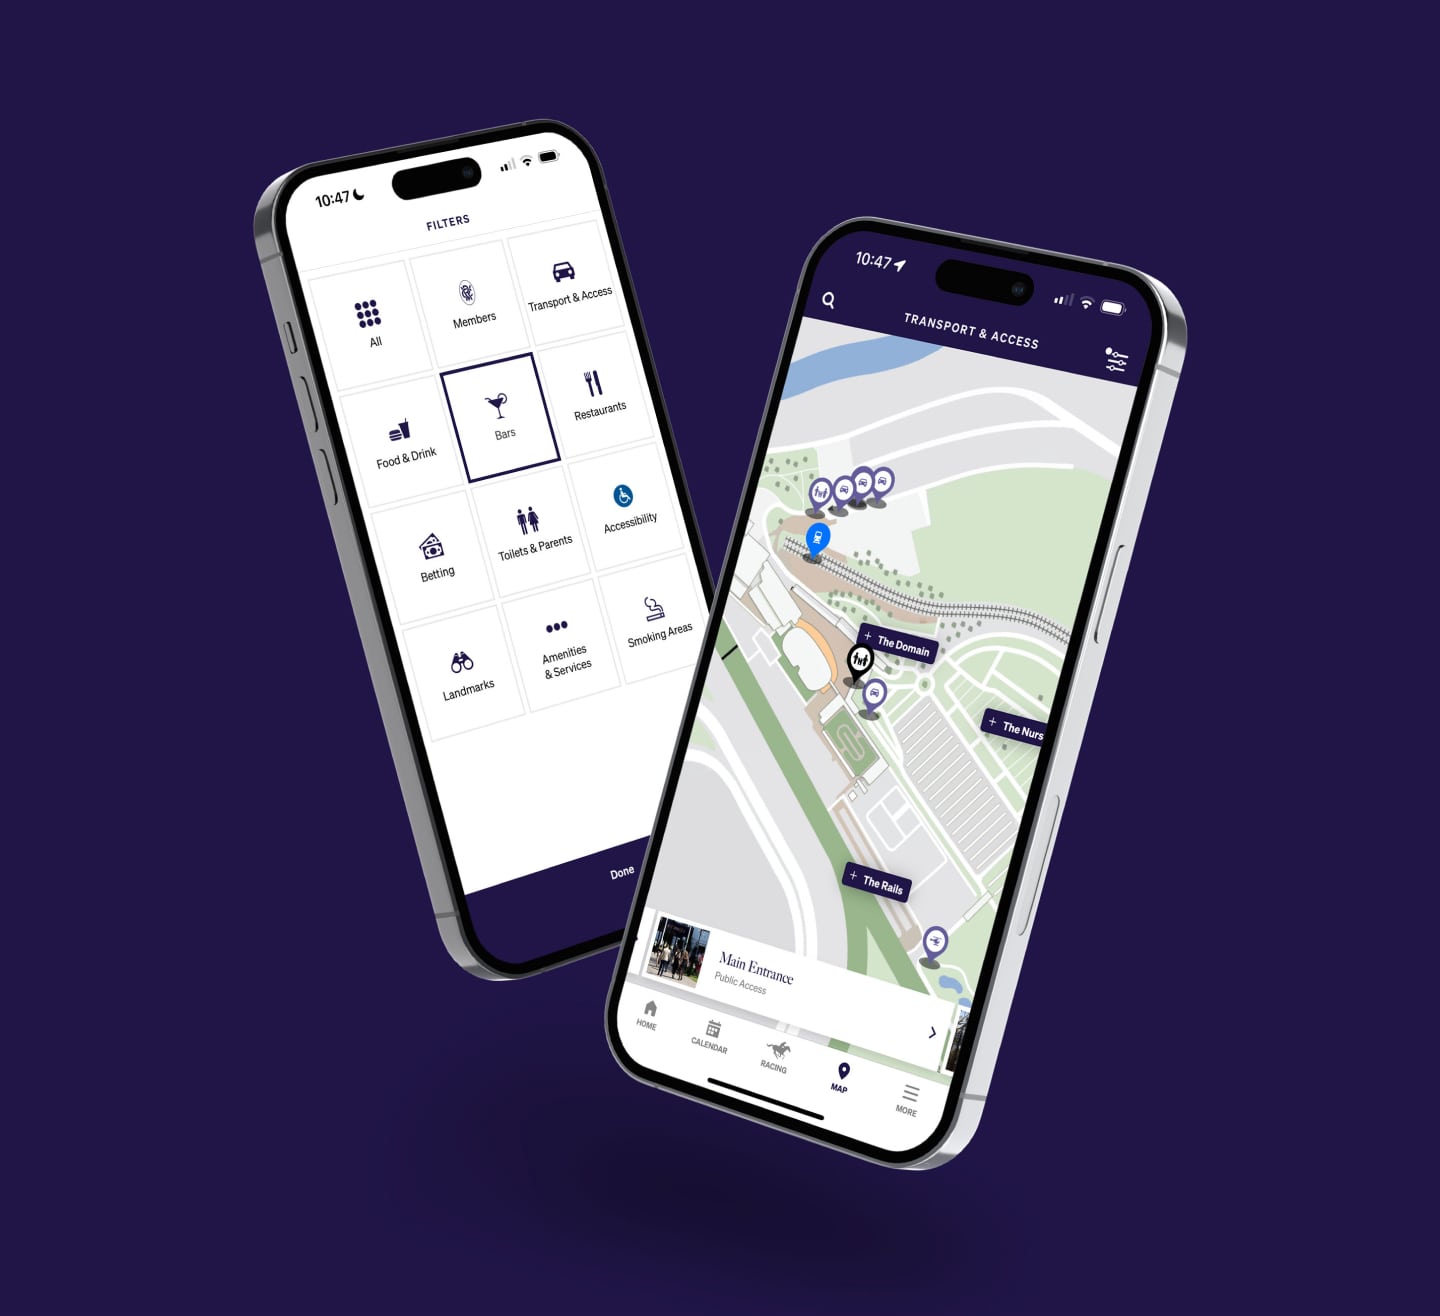
Conduct has been working with the Victoria Racing Club for nearly a decade. The Flemington Raceday Guide app provides patrons and members with up-to-the-minute information to support their live experience. Features include: live and replay video, mapping and wayfinding of event grounds, a full race day guide, real time public transport information and access to digital memberships and historical data to help attendees plan for a smoother day pre, during and post event.
3: Context matters
Prepare users with necessary context beyond the map interface. Use overlays or modals to display information before entering the map, enhancing understanding and guiding interactions. This is particularly relevant in more complex GIS solutions, where microcopy may need further explaining.
4: Quality Data is Key
Reliable, up-to-date geographic data is crucial. Outdated data leads to navigation challenges. Invest in quality data sources and user-friendly administration layers for real-time updates.
5: Balance data and processing demands
Complex GIS solutions require more resources. Address limitations in internet availability with data caching. Communicate loading times and plan for the necessary hardware requirements users will need (especially field workers) to ensure better performance.
Below is an example of clustering and filtering in maps for the CanopyIQ platform we designed for ETS. Clustering simplifies the display of many tasks by grouping close ones together when zoomed out, making maps less cluttered. As users zoom in, these grouped tasks separate into individual ones, aiding in understanding the overall information and enabling a clearer view of details when needed. Activating filters makes irrelevant tasks fade, letting users concentrate on the information that matters. Filtering helps navigation, prevents overload, and enhances work efficiency.
6: Re-evaluate your need for a map-based interface in the first place
GIS solutions and map-based interfaces can be complex to design and implement. While we’ve introduced different methods and techniques to combat the inherent challenges, the easiest way to address this complexity is to reevaluate the necessity of using a map in the first place. Maps address specific use cases. Consider user goals—location precision versus additional information—before opting for a map solution.
Driving smarter business decisions
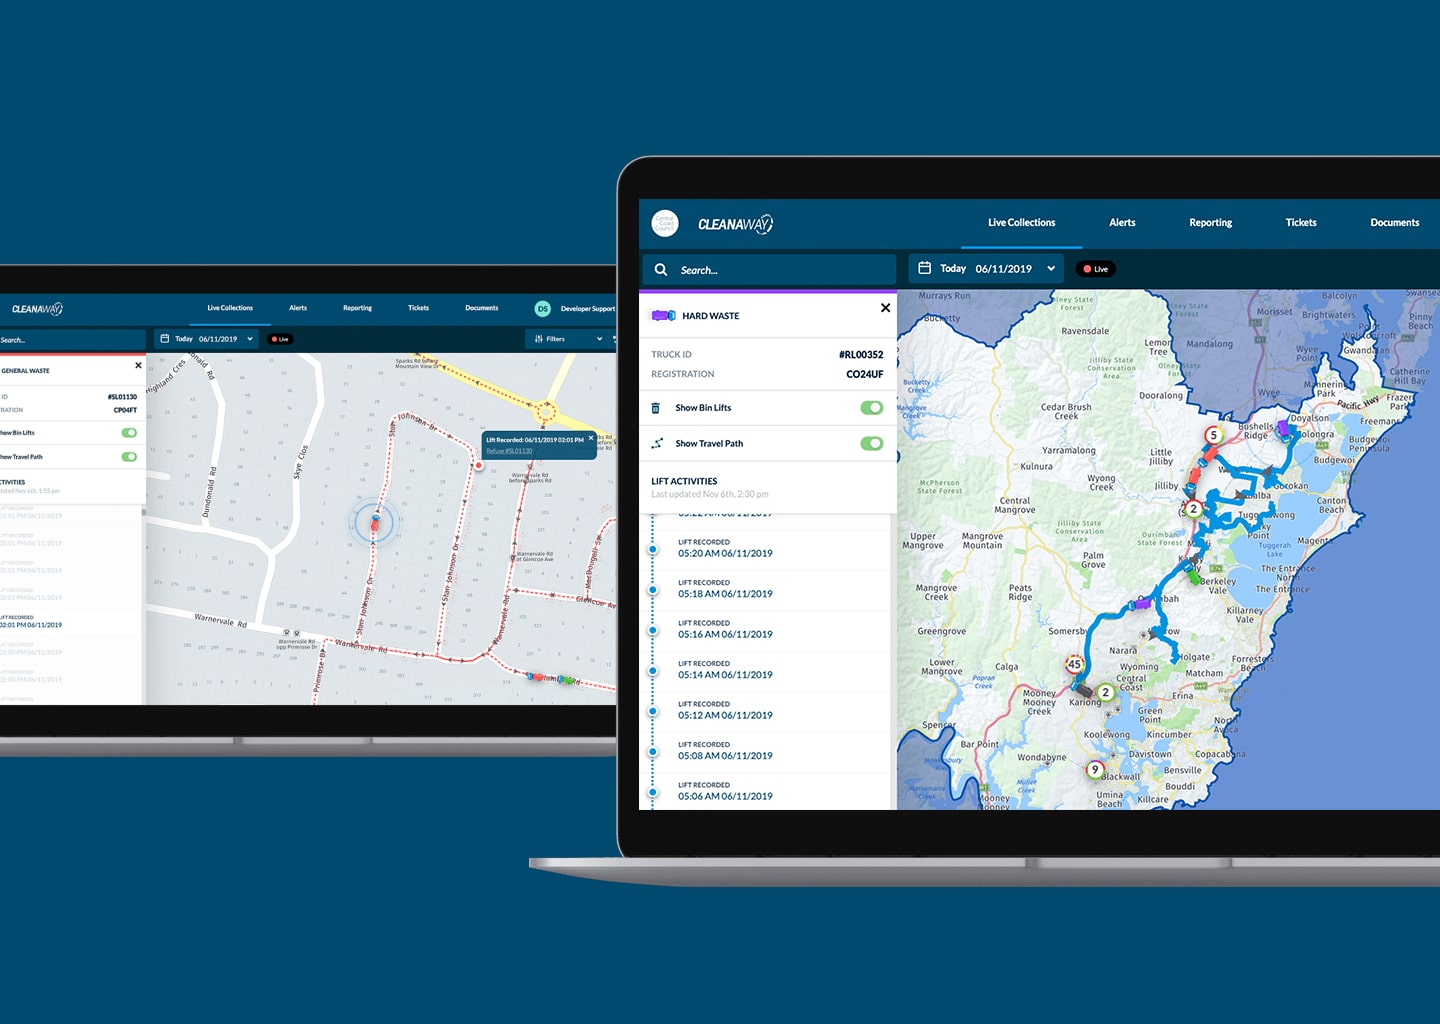
GIS solutions are incredibly useful for supporting both back office operations and field teams due to their ability to integrate map-based data with operational processes. Location data allows for a deeper understanding of where events are happening, assets are located, and resources are needed. By documenting actions and tasks with precise location data, organisations can provide an audit trail that demonstrates compliance and responsibility. We’ve customised map interface technology like ArcGIS and Mapbox in products over the years to enable real-time data exchange and provide a visual context for data, allowing decision-makers to analyse information in a spatial context. This ensures everyone has access to the latest information, facilitating improved collaboration and swift, well-informed responses to changing circumstances.
Below you will find a key feature in the digital product suite we created for Cleanaway is intelligent truck tracking using map technology from HERE WeGo. The maps display trucks ongoing activities in real-time, providing detailed address-level information of waste collection incidents, such as instances of overflowing bins or bin contamination. If a truck driver encounters any of these events while using the mobile app within the truck, they can swiftly report the event in a few clicks, making data instantly available for support staff.
Conclusion
The landscape of Geographic Information System (GIS) solution design is marked by intricate challenges that demand a thoughtful and strategic approach. It’s important to find a happy balance between design, data, and user expectations.
Navigating the complexities of visual load and information density requires a user-centric approach and looking at user journeys holistically will serve as a compass for effective GIS solutions. Supplement interfaces with clear context to establish coherent and contextual experiences. Current and accurate data sources, coupled with responsive administration layers will fortify the reliability of GIS systems, facilitating swift decision-making and operational precision.
Lastly, we recommend a critical evaluation of whether a map-based interface aligns with your user’s intent. Conduct has harnessed a wealth of experience to create GIS solutions that empower organisations across various sectors.
Connect with us to explore how our insights and expertise can bring your GIS project to life
Contact